P&K 3782
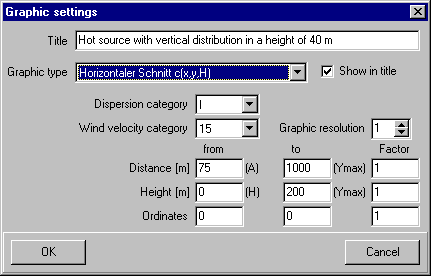
Settings for illustrations of concentration courses and plume sections
Product has been archived / Produkt wurde archiviert

Graphic type
Selection list of graphic illustrations.
Dispersion category
The plume illustration can be limited to one dispersion category.
Wind velocity
The plume illustration can be limited to one wind velocity.
Distance
For detailed tests the illustration can be limited to a distance range of interests. The starting value of this range in meters from the source can be entered here. If the starting value is higher/equal to the ending value, an automatic scaling will be performed. In the graphic type (c(A,y,z)) the cut distance from the source must be entered here.
Height
For the graphic types c(x,zmax) and g(x,zmax), curves with existing vertical distribution for any height above the ground and curves without vertical distribution for the receptor point level can be illustrated.
For the illustration of a vertical cut (type c(x,z), g(x,z) and c(x,y)) the starting value of the height range can be entered here. If the starting value is higher/equal to the ending value an automatic scaling will be performed.
For the illustration of the horizontal cut (graphic type c(y,z)) the cut height has to be entered here.
Ordinates
For detailed tests, the illustration can be limited to a distance range of interests. The starting value of this range in meters from the source can be entered here. If the starting value is higher/equal to the ending value, an automatic scaling will be performed.
Graphic resolution
For time reasons, the graphical illustrations will be set up not with the total resolution of the display, but with a smaller resolution around the factor of these parameters.
Show in title
If this checkbox is selected, the graphic type will be shown in the graphic title.
Factor
Scale factors, with which axis labels are converted into legible dimensions. The factors will be attached to the titles.

