P&K 3950
Layout of the graphic
Product has been archived / Produkt wurde archiviert
Result output form

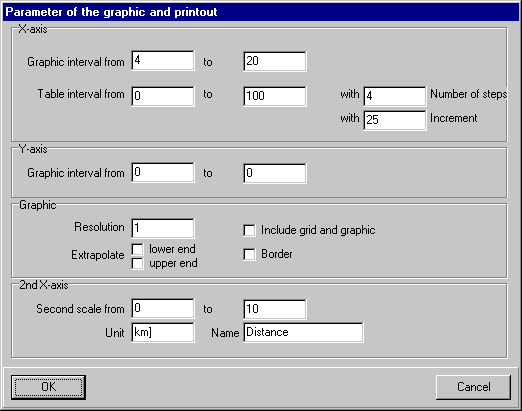
In this form, all project related parameter are to be found, which modify the layout of the graphic and the Function Value Table.
X-axis
Graphic range from / to:
The X-axis sector which is illustrated in the regression graphic cannot be set here. If "from" is not smaller than "to" the axis will be determined automatically.
List area from / to:
The list area of the table output between "from" and "to" is distributed among a number of "steps".
Number of steps: Number of lines in the table.
Increment: (to - from) / Increment is the result of numbers of lines.
Y-axis
Graphic range from / to:
The Y-axis sector which is illustrated in the regression graphic can be set here. If "from" is not smaller than "to" the axis will be determined automatically.
Graphic
Graphic resolution
1 equals the highest resolution and is the slowest. The Microsoft GUI starts the line pattern new at every point. Therefore, in order to have a distinguishable dash-dot line, a value greater 1 has to be entered.
Raster in the graphic
draws a raster over graphic.
Extrapolate lower end/ upper end
extends the graphs over the range of validity.
Border
Draws a border around the graphic.
2nd X-axis
Data of a second X-axis can be defined here. To activate the second scale, the first scale has to be defined also. From < to and the name must not be empty.
Second scale from / to
This is the starting and end value of the scale. They are drawn under their counterparts in the first axis.
Unit
Unit of the second scale.
Name
Name of the scale.

