P&K 3782
Illustrations of concentration courses and plume sections
Product has been archived / Produkt wurde archiviert

This program can generate some illustrations of the plume. How the illustrations are derived from the Concentration Array, can be defined in the form Settings for illustrations of concentration courses and plume sections. The color palette to be used in sections can be defined in the form Configuration of the color scale.
Most of the illustrations can be zoomed; therefore a rectangle has to be opened with the mouse from the upper left corner to the lower right corner. To reset the zoom, a rectangle from the lower right corner to the upper left corner has to be opened with the mouse. Also the graphic can be moved; therefore the graphic is to be dragged with the right mouse button down. The button 3D turns the graphic back into two-dimensional illustration. With some of the buttons in the toolbar the graphic can be turned into a three-dimensional illustration. By using the setup button, a form can be opened in which more graphic parameters can be set. This function is meant for final detailed work and these settings will not be stored.
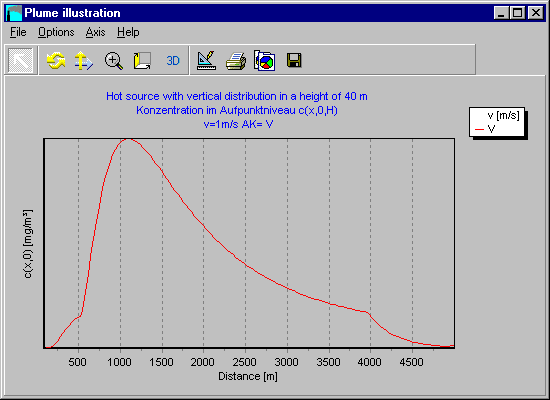
Here are some sample illustrations
- Ambient air concentration at the height of receptor point level c(x,0,H) [mg/m3] (in case of existing vertical dispersion any height)
- Depletion factor (has no unit) g(x,0,H)
- Ambient air concentration on the ground c(x,0,0) [mg/m3]
- Height of the waste gas plume h(x) [m]
- Ambient air concentration in the vertical cut in the plume axis c(x,0,z) [mg/m3]
- Depletion factor in the vertical cut in the plume axis g(x,0,z) (has no unit)
- Ambient air concentration in the vertical cut, vertical to the plume axis (c(A,y,z) [mg/m3]
- Ambient air concentration in the horizontal cut c(x,y,H) [mg/m3]
See also: Operations within the graphics

